Page 1 of 1

Mystery To Solve

Posted: 14 Sep 2017, 15:31
by Peter (vital1)
Image

A concerned person sent me this small sample of Cerium optical polish to test with my scintillator equipment. They detected high cpm when they tested a small amount with their Geiger counter.

Cerium Dioxide is a rare earth, used widely for glass and lens polishing. It is supplied in different colours. Tan to dark brown are the most common colours. These colours indicate the presence of iron. Cerium Dioxide that is pure white in colour, is a lot more expensive to buy.

Reportedly, in the USA, a large optical manufacturer had all their cerium polish, plus a semitrailer load of ground glass, grinding, and polish sludge, impounded by the EPA, because it was found to be very radioactive.

By itself, pure Cerium oxide dry dust inhalation can be a health hazard, let alone adding radioactive contamination to the mix.

I also tested this sample with a sensitive Pancake Geiger counter. It was only a Beta and Gamma test, as I left it in the zip lock bag it was sent to me in. This small sample measured ~235 cpm above background level. Gamma testing, using a 2" scintillator probe, minus the test chamber 8 cps background, was 12 cps.

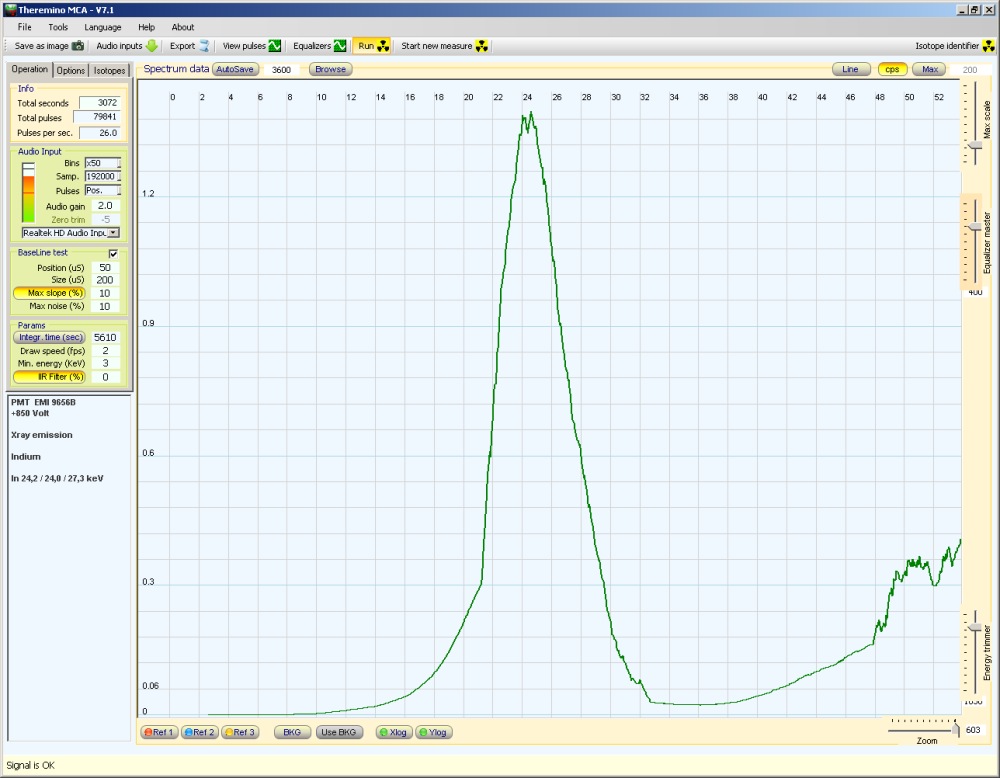
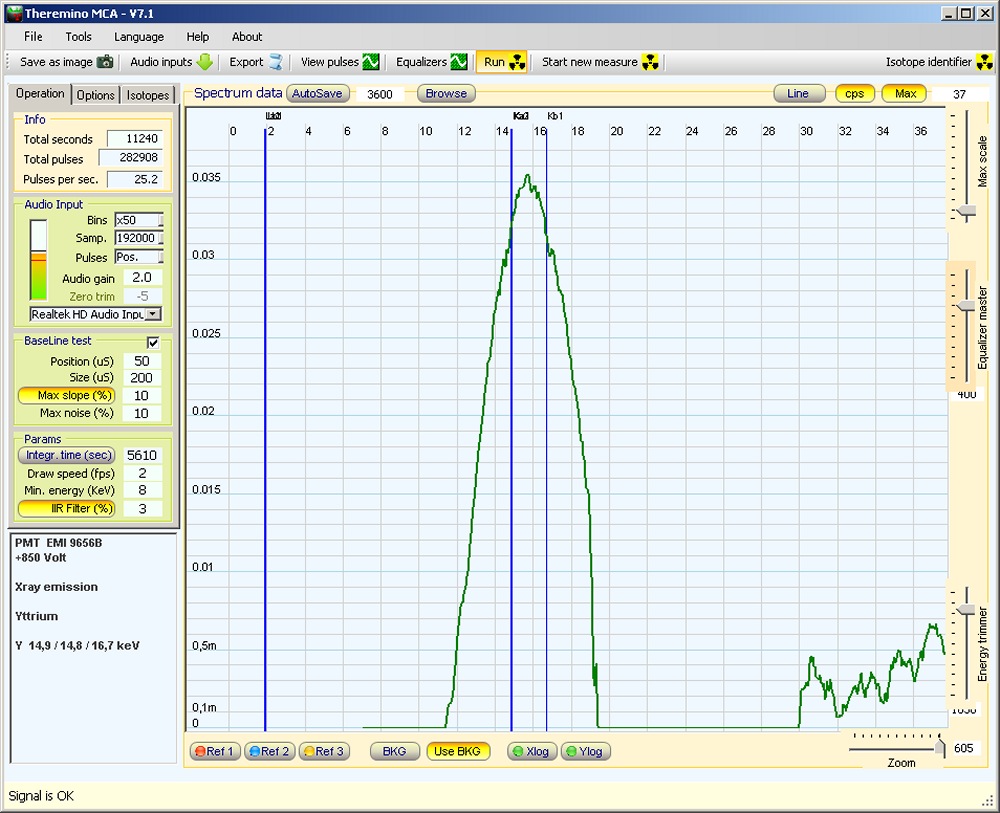
Reports indicate that samples of dark brown Cerium Dioxide may sometimes be contaminated with Thorium, which this sample test here, shows to be the case. As well as the Pb-212 peak, (the decay daughter of Thorium-232), peak positions suggest that some Pb-214 may also be present.

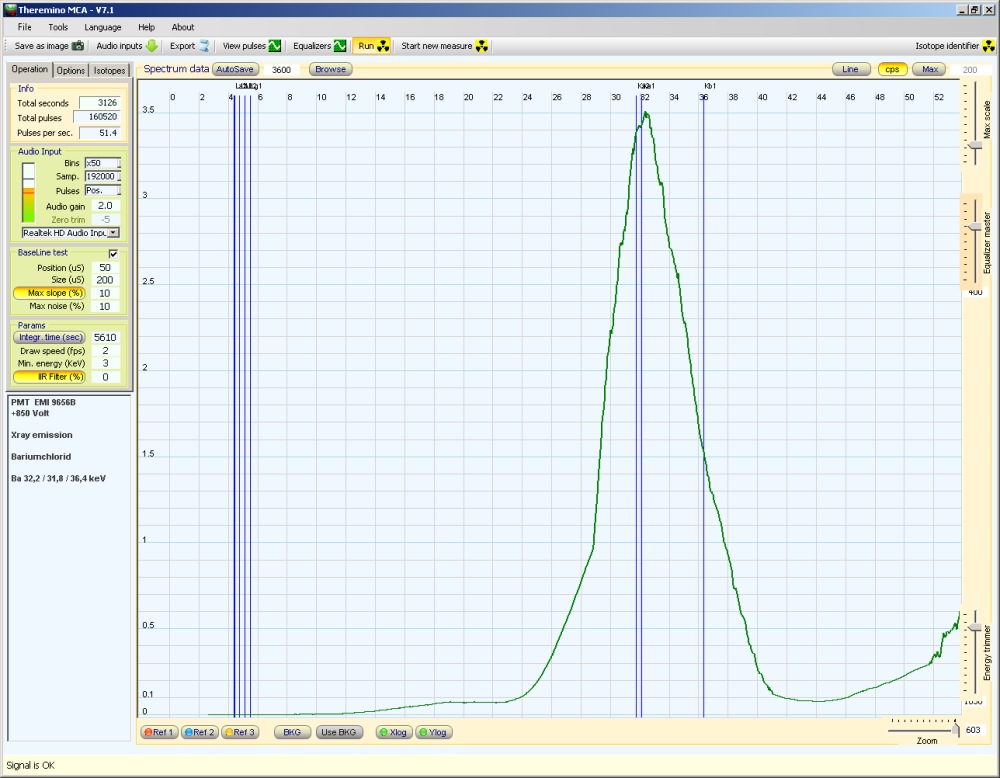
The peak that stands out is the peak at ~31 kev. I have not been able to identify it. You would expect to find Cesium-137 when you see X-ray peaks this high, at this energy. There is no indication in the chart that it is.

One possibility is that there is some naturally occurring Cesium mineral present, and with the high beta radiation level, is creating Bremsstrahlung radiation from the Cesium. This is just a guess.

Does anyone here have any alternative suggestions for the source of the ~31keV peak?

Re: Mystery To Solve

Posted: 14 Sep 2017, 17:08
by cicastol
Ce Ka1 X-ray line 34.7 keV, beware that NaI(Tl) is nowhere linear under 100keV.

Re: Mystery To Solve

Posted: 16 Sep 2017, 15:47
by Peter (vital1)
Yes, that was one of the first things I did, was look up the X-ray for Cerium. I did not realize that even with calibration the accuracy could be out by so much, below 100 keV.

For this test I used a sample of radioactive contaminated lead solder to calibrate below 50 keV. It provides a calibration peak at 22.2 keV X-ray for the Sliver content, plus 46.6 keV peak for the radioactive Lead-210 at 46.5 keV contamination.

This solder was purchased from a local electronics shop, so check all your solder before use. Contaminated solder could damage the accuracy of those radiation detection equipment projects!

I will run some more tests just concentrating on this area of activity, and not the whole spectrum.

Re: Mystery To Solve

Posted: 16 Sep 2017, 18:05
by MaxGaspa
There are several sources of non linearity preventing the linear calibration from being correct in a large range of energies. The crystal itself is not linear and its non-linearity is getting worse at lower energies. Usually a linear energy calibration works in a limited range of energies, but how much limited? And what is the error you have in your calibration? The limitation of the Theremino software is that just linear calibration is possible, but there are no linear system in the real world!.

When you consider a measurement you have to consider the measurement error as well. Without an estimation of its error any measurement is easily useless. So when you are saying that the peak is at 31 Kev which is its error? +/- 1%? +/- 10%?

If you are using a 0->2Mev interval you should expect to get 20% of error at 20 keV, that may be ok for the amateur. But you should be aware of that!

Moreover there are several "software tricks" in Theremino that may change the spectrum introducing a non linear distortion. The "equalizers" are a cosmetic trick useful in the amateur world to get nice spectrum. Usually I'm used to turn off all the software tricks (equalizer, supe-rcorrelation....) and then I export the raw data to be processed using a different software.

A better and quantitative calibration may be obtained with a quadratic "best fit" calibration using more than 4 peaks.

For example using 2" NaI crystal from Scionix and several sources from spectrum Techniques I may easily get several peaks. The sources permits a very quick acquisition of the peaks, you need quick operation because during both calibration and measurement temperature and HV voltage should be stable and this is difficult ( but possible ) to be guaranteed for several days in the amateur world.

Have a look at the "best fit" of the peaks using a linear calibration or using a quadratic calibration.

The linear one has 40% error at 30 keV and at greater energies the error is 1-2 %

Fitting to a Polynomial of Order 1
C[0] + C[1] x
------------------------------------------
C[0] = -16.2616 +/- 5.05085
C[1] = 0.974231 +/- 0.00673342
Chi-Square = 446.154
Weighted Error = 49.5317 %


------------------------------------------
Channel Energy Fitted Energy Fitted Error(%)
39.59 32.19 22.31 44.31
222.08 201.83 200.10 0.87
261.99 238.66 238.98 0.13
333.24 307.78 308.39 0.20
622.00 583.19 589.71 1.11
710.01 661.66 675.45 2.04
1221.90 1173.23 1174.15 0.08
1373.60 1332.49 1321.94 0.80

Using a quadratic calibration you get an improved fitting

Fitting to a Polynomial of Order 2
C[0] + C[1] x + C[2] x^2
------------------------------------------
C[0] = -2.3675 +/- 2.48804
C[1] = 0.908599 +/- 0.00920213
C[2] = 4.50659e-005 +/- 6.14357e-006
Chi-Square = 37.9324
Weighted Error = 6.6936 %


------------------------------------------
Channel Energy Fitted Energy Fitted Error(%)
39.59 32.19 33.67 4.40
222.08 201.83 201.64 0.10
261.99 238.66 238.77 0.05
333.24 307.78 305.42 0.77
622.00 583.19 580.22 0.51
710.01 661.66 665.47 0.57
1221.90 1173.23 1175.13 0.16
1373.60 1332.49 1330.71 0.13

So if you are using a big range of energies you need a quadratic calibration (or using a multi interval linear calibration that gives more or less the same result of the quadratic one if the peaks are evenly distributed). Don't use a higher degree polynomial.

But I understand that in the amateur world you would use Theremino only to make everything easier and you don't need high precision measurement (that can be obtained in a professional environment only). That's OK but you should be aware of its limitation.

Another possible solution is to limit the range of energies to a small interval, but what is "small enough"? It depends on the amount of error you can accept.

Hope this helps

Max

Re: Mystery To Solve

Posted: 20 Sep 2017, 12:16
by Peter (vital1)
Thanks for going to the time and trouble to provide a very detailed explanation of non linearity of crystals at low energies. I was aware of the non-linear problem of crystals. I was not aware that it was much worse at these low energies, so this information has been very helpful.

----------------------------------------

"For example using 2" NaI crystal from Scionix and several sources from spectrum Techniques I may easily get several peaks."

I use a Thorium gas mantle sealed in a container, for quick multiple peaks calibration. If I am Interested in peaks below 75 keV, I calibrate using the contaminated lead solder sample, which provides low energy peaks at 22.2 kev and 46.5 keV, or alternatively 26 keV and 60 keV from an old smoke detector.

Re: Mystery To Solve

Posted: 21 Sep 2017, 18:10
by Peter-1
Hello Peter,
to check the linearity of my system in the low region I test it with the X-ray fluorescence. Stimulation is a small Am241 emitter.
Barium for 31.8 32.2 and 36.4 keV
Image

Indium for 24.0 , 24.2 and 27.3 keV
Image

Yttrium for 14.8 , 14.9 and 16.7 keV
Image

I think this is a simple test and works well.
Peter