Energy per Bin (Channel)
Posted: 30 Mar 2019, 21:45
Hi All,
I was testing a new 2" NaI(Tl) detector today, I recorded a 30 minute background spectrum with the detector sitting on my desk (see spectrum below in red). Represented in linear form it comes out as predicted with a little hump for K40 approximately in the middle and no significant stand out features. Obviously our histogram is showing the counts in each bin.
Then I was wondering how it would look if we plotted energy per bin instead of counts per bin, so I calibrated the spectrum in PRA and exported the histogram to a spreadsheet where I simply multiplied the energy by the number of counts in each bin, and plotted it (see green spectrum below).
Immediately it is possible to see more detail and structure in the spectrum. Since this is a very simple calculation to do, I don't know why the programmers have not added this feature as a third option to the usual Lin and Log options.
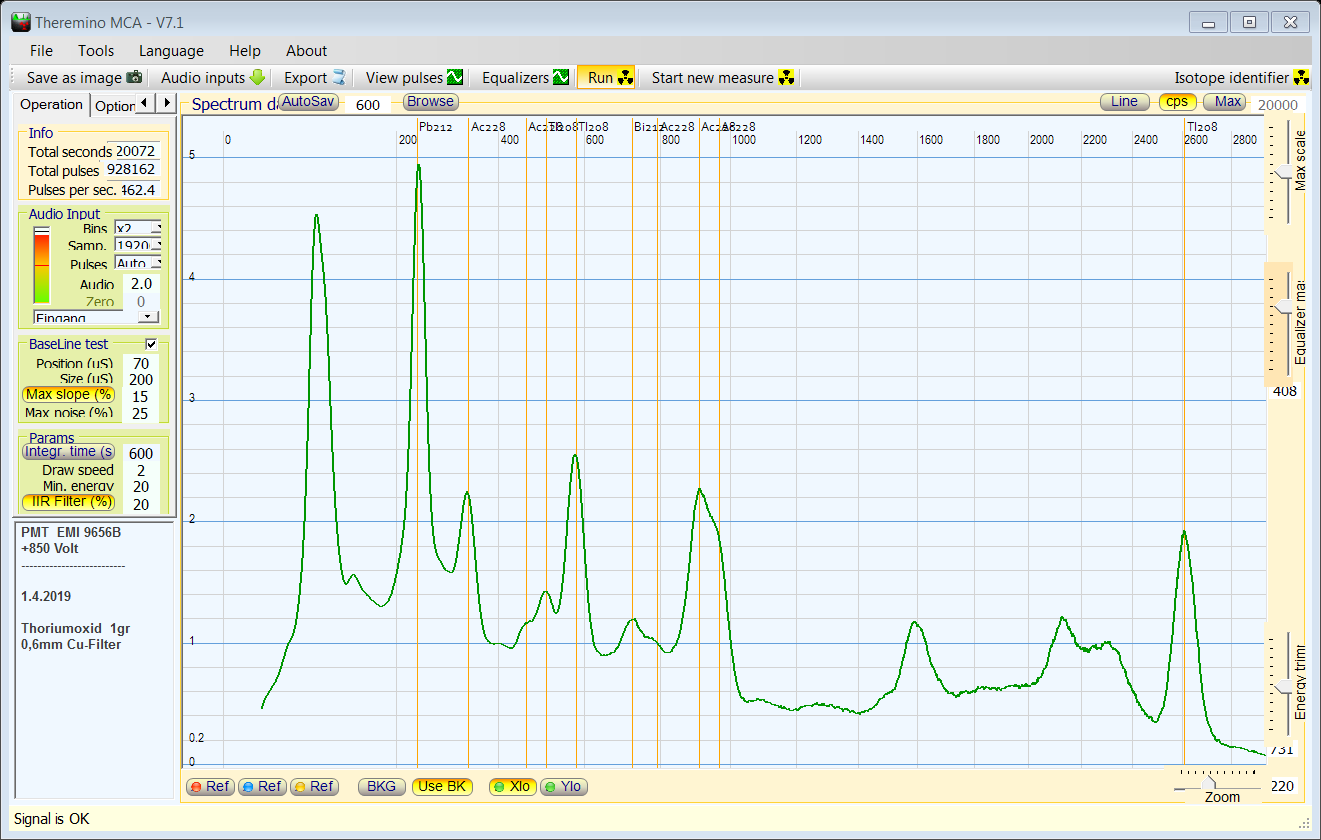
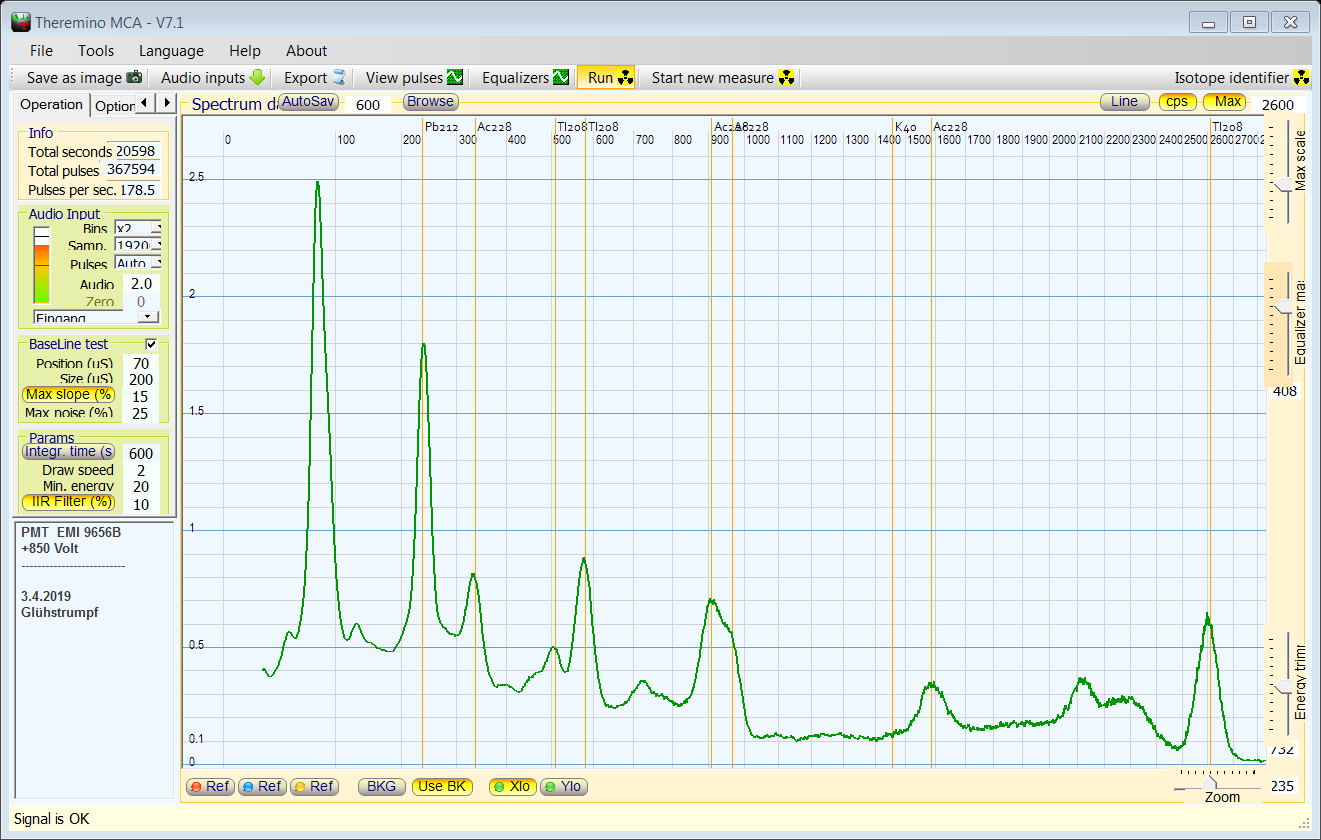
In the spectrum below we can see K40 stands out very prominently at 1460, we also see Ti208 at 583 and Pb212 at 238 etc...
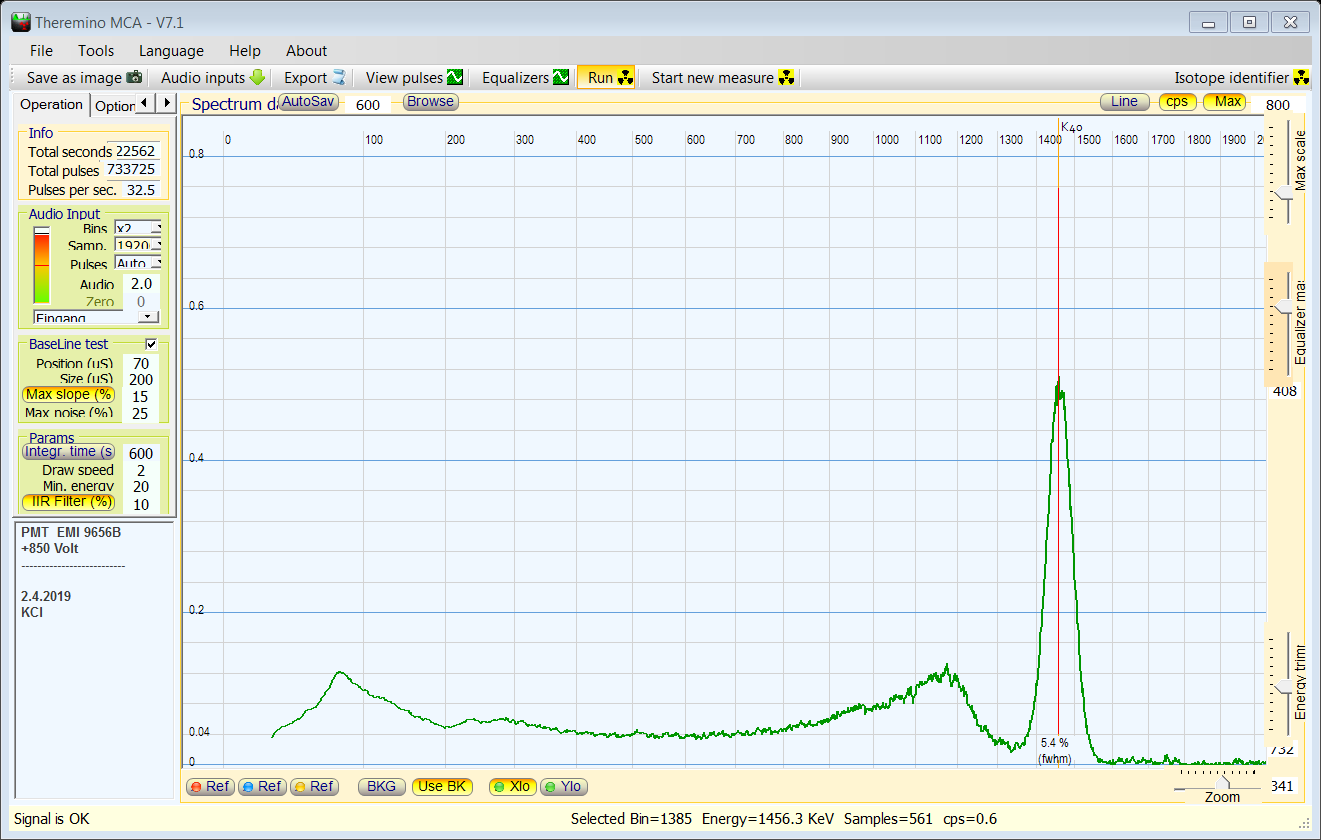
Below I also feature a Cs137 spectrum, represented both as counts and energy, as you can see the features change and the 662 peak becomes more prominent.
It's possible that this feature is common on other software and that I haven't seen it, but thought I would share it with you guys anyway.
Steven
I was testing a new 2" NaI(Tl) detector today, I recorded a 30 minute background spectrum with the detector sitting on my desk (see spectrum below in red). Represented in linear form it comes out as predicted with a little hump for K40 approximately in the middle and no significant stand out features. Obviously our histogram is showing the counts in each bin.
- Counts per bin
- counts.png (52.8 KiB) Viewed 9152 times
Then I was wondering how it would look if we plotted energy per bin instead of counts per bin, so I calibrated the spectrum in PRA and exported the histogram to a spreadsheet where I simply multiplied the energy by the number of counts in each bin, and plotted it (see green spectrum below).
Immediately it is possible to see more detail and structure in the spectrum. Since this is a very simple calculation to do, I don't know why the programmers have not added this feature as a third option to the usual Lin and Log options.
In the spectrum below we can see K40 stands out very prominently at 1460, we also see Ti208 at 583 and Pb212 at 238 etc...
- Energy per bin
- energy.png (71.69 KiB) Viewed 9152 times
- Cs137 Comparison
- cs137.png (63.73 KiB) Viewed 9146 times
Steven