This is a question and post about determining "activity" from a dose-response curve. I'm hoping that the "Spectrum" board will be an OK place to post this. Since I'm still a new user of the GS-USB-PRO and PRA software the main question I have might already be known to experienced users and gamma ray spectroscopy experts, but I did the following experiments to try to determine how to find the lowest level of activity of an isotope in a sample.
First of all - an admission... I bought WAY too much Cs-137. The photograph below shows my collection (0.01, 0.05, 0.1, 0.25, 0.5, 1, 2 and 5 uCi sealed samples).

- Sealed Cs-137 Sources.png (348.77 KiB) Viewed 9036 times
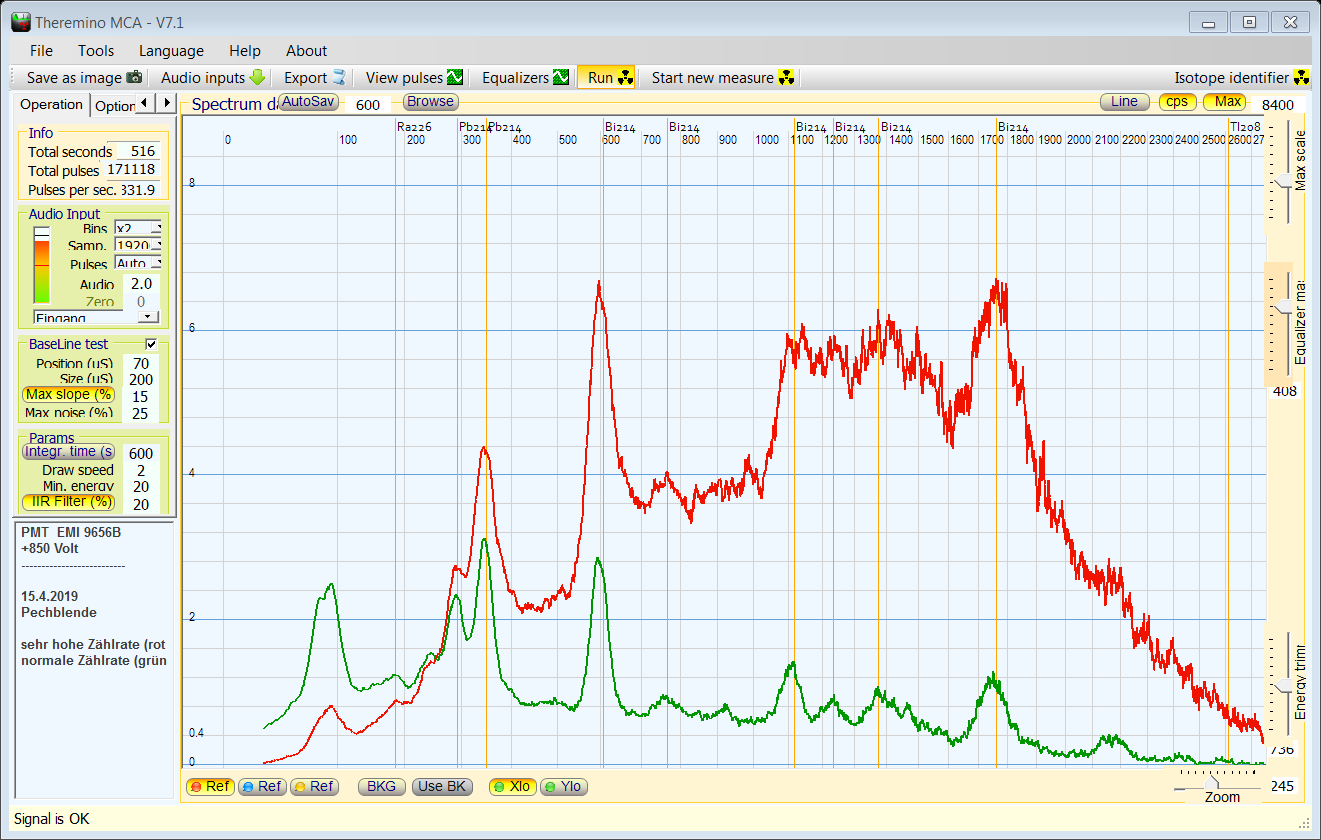
Why I think I have too much Cs can be seen from the following spectra collected for 5 minutes (300 seconds). I wanted to ensure that I had a wide spread of Cs-137 activities (amounts) to provide a good dose-response curve but am learning that one can't measure such a wide spread of activities using identical conditions and times and have the spectra be that useful for analytical purposes.
.png (282.04 KiB) Viewed 9036 times")
- 300 second spectra for 0, 10, 50, 100, 250, 500, 1000, 2000 and 5000 nCi Cs-137 1" sealed sources.
In the previous figure showing all the spectra, the areas totaled are shown with gray shading (since I haven't learned how to do that in PRA it was done in Excel). Plotting the total counts in the shaded area vs. the activity of the calibration sources, and fitting those curves with either a linear (straight-line) and nonlinear (single-phase associative) fit yields the following data:
The results are shown with both standard (linear) and logarithmic (base 10) axes to highlight how the linear fit really stinks at the lower activity levels. This would lead me to think that the nonlinear fit is more appropriate -but this could be wrong!
Averaging five independent spectra for each source for all of my sources (measured using identical GS-USB-PRO volume settings, analysis times and the like) gives the following data:

- Dose Response Data.png (4.85 KiB) Viewed 9036 times
Using the modified GS-STANDUP and holder allowed each sample to be presented to the shielded detector in a precise way each time resulting in such great statistics! Plotting the average total counts (in the areas of interest) against the activities resulted in the following figures (plotted with linear and logarithmic axes for my 'old-school' eyes):
 Viewed 9036 times")
- Cs-137 Dose Response Curve. (Error bars for each data point are too small to be seen.) These data are fit with a single-phase associative nonlinear model.
In the log-plot the background total counts are shown as the horizontal dash-dot-dash line.
A careful observer will notice that the graphs do not show the same number of points as I've disregarded the data from anything above 500 nCi when calculating the fit. [More accurately, when I let the fancy-schmancy graphing and statistics software calculate the fit.] I don't know if this is appropriate for gamma spectroscopy but I did it for the following reasons:
(1) My years of experience in optical spectroscopy and chromatography tell me that when "peaks" stop looking Gaussian (or Lorentzian) it usually means that detectors are being saturated with signal or columns are overloaded with too much sample; the shapes of the 662 keV peaks in the spectra for the 2 and 5 uCi sources show that this might be the case for the conditions under which the data was collected.
(2) Unless the activity of the calibration sources are evenly spaced the higher concentration samples have a greater influence (weight) on the curve fit than the lower activity standards. Since one of the reasons I ran these tests was to determine how low of an activity I can reliably detect (with statistical significance) I wanted to use as many of the "good looking" spectra without the higher and less-perfect spectra.
Using the statistical fit from the software indicates that the lowest detection limit for these conditions would be around 1-2 nCi (>68% confidence) or around 4 nCi (99.5% confidence). The logarithmic plot using the data from 10 - 500 nCi indicates that these results are not unreasonable. (Sorry, but I'm so old I remember curve fitting with calculators and graph paper so I am still prone to examining plots rather than just believe what some computer program told me the answer is...) I'm assuming that I can go lower (down in the pCi range) if I change the GS-USB-PRO settings and up the count times but I can't talk the guy at Spectrum Techniques to make me a source below 0.01 uCi (yet) so I can test it.
NOW FOR THE NEWBIE QUESTION: Is it already known that activity vs total counts fits a linear model or am I getting a nonlinear model due to my novice conditions? Any wisdom from experienced users or theoretical gurus would be welcome!