Looks like you have quite the detector collection! I still need to add SrI and CZT to mine.
The resolution of your LaBr looks a bit low, the two peaks around ~950 keV should go down to the baseline.
What time constant and PMT did you use with that one?
SrI2(Eu) detectors
-
GigaBecquerel
- Posts: 172
- Joined: 04 Jul 2020, 07:34
- Contact:
-
Rob Tayloe
- Posts: 175
- Joined: 10 Nov 2020, 12:00
- Contact:
Re: SrI2(Eu) detectors
The LaBr detector is one that I had Steven Sesselmann build for me. He discusses his tests with this detector in a separate posting (under LaBr around Nov 2020). He used PRA in his tests whereas I am using Theremino. One of these days I will feel proficient in using PRA, but for now Theremino is much easier to use. I am using a GS-USB-Pro that I obtained from Steven along with the LaBr and retained its settings initially. I did try a lower voltage (around 510 volts, but found that even with the gain (volume) turned to max, the peaks were too crowded towards the lower end in Theremino. Raising the voltage back to 555 volts alowed me to slightly reduce the volume and have the gamma peaks more distributed through the Theremino "bin" space. As you can see with my energy cal for the LaBr the energy response is less linear than the other detectors.
Some of the relatively poor results with the LaBr could be due to Theremino and some to pilot error. For the present my focus was on the Strontium Iodide detector.
For each of the four detectors a different software package is used. When one is doing an energy calibration ideally one would fit (e.g. using least squares methods) a Gaussian curve to the photo peak and identify the peak value associated with a given known energy (i.e., ~662 keV for the Cs-137 peak). With some packages the option is to identify a "centroid" in a defined region of interest. In other instances, perhaps due to inadequate counts, it is easiest to just locate the channel in the vicinity of a peak having the highest counts. In some instances with the CZT detector the resulting peak is not symmetrical and does not appear to have a normal or Gaussian shape. For this initial energy calibration I mostly used relatively short duration counts and picked the channel with the highest counts (in a peak area).
For the Strontium Iodide detector I played a good deal with settings in the MaxE PulseCounter software. I set the scale factor so that the 662 keV Cs-137 peak would occur at channel 662 of a total of 2000 channels. I noticed that over several days the Cs-137 peak would move towards a lower channel even though the scale factor remained unchanged. A few days ago I re-set this scale factor and I am checking if this drift continues.
At the end of each measurement my practice is to make a screen capture so that the viewable settings can be revisited. I then save the spectrum in whatever is the "native" mode, if available, for further recall. Then I save the data in an ASCII format which is usually ending with a csv extension.
The ASCII data is pulled into an excel spreadsheet. I assign sequential channel numbers if none are included in the ASCII file. I then use my polynomial energy calibration data to get a curve of counts vs energy. The graph shown earlier was the result of these curves.
I have downloaded the Interspec software, but have yet to spend much time with it. I also have some older fortran programs that I might see about modifying and using. Plenty to do that's for certain.
-
Rob Tayloe
- Posts: 175
- Joined: 10 Nov 2020, 12:00
- Contact:
Re: SrI2(Eu) detectors
It may be that I need to spend more time getting familiar and confident with PRA. I think that I will also explore using a different MCA / software with the LaBr to see if that makes some difference. For the monazite gamma spectrum measurement used in the figure above I just used Theremino v. 7.3 "out of the box", e.g. as downloaded with no modifications. Shown is the Theremino screen shot with the Monazite sand sample.
-
GigaBecquerel
- Posts: 172
- Joined: 04 Jul 2020, 07:34
- Contact:
Re: SrI2(Eu) detectors
Ah, I understand!
I am not sure if you can achieve the best possible resolution with LaBr and a Soundcard, as it really wants a short time constant of ~300 to 500 ns.
Have you tried Becqmoni? That's where I got my best results with the HPGe. Also, try disabling the IIR filter in theremino, as it just smoothes out your spectrum and doesn't actually help with resolution or even averages out small peaks
Re: SrI2(Eu) detectors
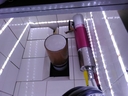
Hi! Just joining into this discussion, I went with the SC-13c-SiPM because of my interest in the low energy side of the spectrum.
One thing I have not been able to get out of Capesym is any sort of a curve of sensitivity over energy. At the moment I'm not seeing much beyond 300keV, with the usual CS137 source, and my Lu176 source shows the 200 and 300keV peaks but very low.
I'm attaching a few screenshots, using Max's pulsecounter software with the Picoscope 3224 (12 bit)
The peak on the left of the CS137 plot is probably just noise, I'm still working with the trigger settings. Each range on the picoscope acts differently.
I noticed that in the spec sheet for the scint, they say to limit the bias current to 500uA, but I've not seen anyone else doing this from what I can see in the pictures. This would be about a 60k resistor in series with the three 9V batteries. Are you guys doing this?
- Attachments
-
-
-
-
-
-
Sesselmann

- Posts: 1374
- Joined: 27 Apr 2015, 11:40
- Location: Sydney
- Contact:
Re: SrI2(Eu) detectors
Although the LaBr3 has a fast pulse, this doesn't mean you need fast sampling, we are only interested in measuring photon energy, which in all cases needs to amplified enormously, first it goes through a PMT and gets amplified 10^6 times then it goes through an electronic amplifier to get another 10X gain, the energy is then dumped into an RC circuit and then the pulse is digitally sampled.GigaBecquerel wrote: ↑16 Jan 2021, 03:20I am not sure if you can achieve the best possible resolution with LaBr and a Soundcard, as it really wants a short time constant of ~300 to 500 ns.
The pulse length is simply a function of the RC time constant.
For those of you who don't already know:
Multiplying resistance in "Ohms" by capacitance in "Farad" you get time in seconds, this might seem a bit counter intuitive, but it works. You can actually ask Google and get the answer;
- Google Time Constant
- timeconstant.png (87.54 KiB) Viewed 11875 times
The GS-USB-PRO allows for adjusting the time constant via the trimmer potentiometer.
Steven
Steven Sesselmann | Sydney | Australia | https://gammaspectacular.com | https://beejewel.com.au | https://www.researchgate.net/profile/Steven-Sesselmann
Re: SrI2(Eu) detectors
"Smath" is an excellent program for these types of calculations. It's free, and it's units aware.
If you've ever used Mathcad (Expensive!) you know how to use Smath.
If you've ever used Mathcad (Expensive!) you know how to use Smath.
Re: SrI2(Eu) detectors
I just got this graph from Capesym, probably useful if not already known.
- 1612554851545blob-SP-focus.png (154.22 KiB) Viewed 11853 times
-
Sesselmann
- Posts: 1374
- Joined: 27 Apr 2015, 11:40
- Location: Sydney
- Contact:
Re: SrI2(Eu) detectors
Attached below is a more comprehensive list of crystal efficiencies.
Surprisingly this is a very common question with beginners, they want to know why size matters ;)
Steven
Surprisingly this is a very common question with beginners, they want to know why size matters ;)
Steven
- Attachments
-
- Efficiency-Calculations.pdf
- Scintillation Crystal Efficiency Calculations
- (1.54 MiB) Downloaded 644 times
Steven Sesselmann | Sydney | Australia | https://gammaspectacular.com | https://beejewel.com.au | https://www.researchgate.net/profile/Steven-Sesselmann
Re: SrI2(Eu) detectors
I understand, I was just passing on the info on the Capesym scints in particular in case this wasn't know previously. I hadn't seen anything like this in their documentation.
Who is online
Users browsing this forum: No registered users and 484 guests
