Hello there,
This week I have no new sample to test, but I have a new device, the Tracerco PED+, Personal Electronic Dosimeter. Not sure if this section is for dosimeters as well , but…well, I hope it is.
The PED shows you the doserate, accumulated dose since last reset and peak dose. You can also choose to see only one or two of them.
You can set various alarms, both for the dose rate and the accumulated dose, the display will tell what your stay time is with the present dose before you reach the first alarm level.
It’s supposed to wore in the high half of your body, typically on your chest, using this clip on your clothes.
It can also work in search mode (handheld, off body use), but it won’t show the accumulated dose in this mode, since this is not how it’s supposed to be used for personal dose.
The dosimeter is based on an energy compensated GM tube, it comes with a calibration test sheet which states it’s within 5% of the corrected dose for two sources of Cs137 and Am241 of known activity.
It says “estimated maximum uncertainty of measurement is +/- 10% at the 95% confidence level”. That’s maybe optimistic but this is what it says. Its range for X-rays and gammas is 33 keV – 3 MeV (written on the back, photo below, with the clip removed), albeit the brochure mentions a narrower one. This goes up to 100 mSv/h. You can buy a version with an extended range (PED+ ER) going as high as 1 Sv/h but honestly I don’t plan to find myself in such a radiation field anytime soon so I thought 100 mSv/h was way more than enough.
You can read more in the brochure and learn more than I can possibly explain here writing on how it works watching this video, apparently made by a radiation-exposed worker who use it on a daily basis.
https://www.youtube.com/watch?v=HbCmDvkQPNk&t=636s
Here’s the brochure, there are several units featured, this one is a pages 7 and 8.
http://qsa-global.com/wp-content/upload ... ochure.pdf
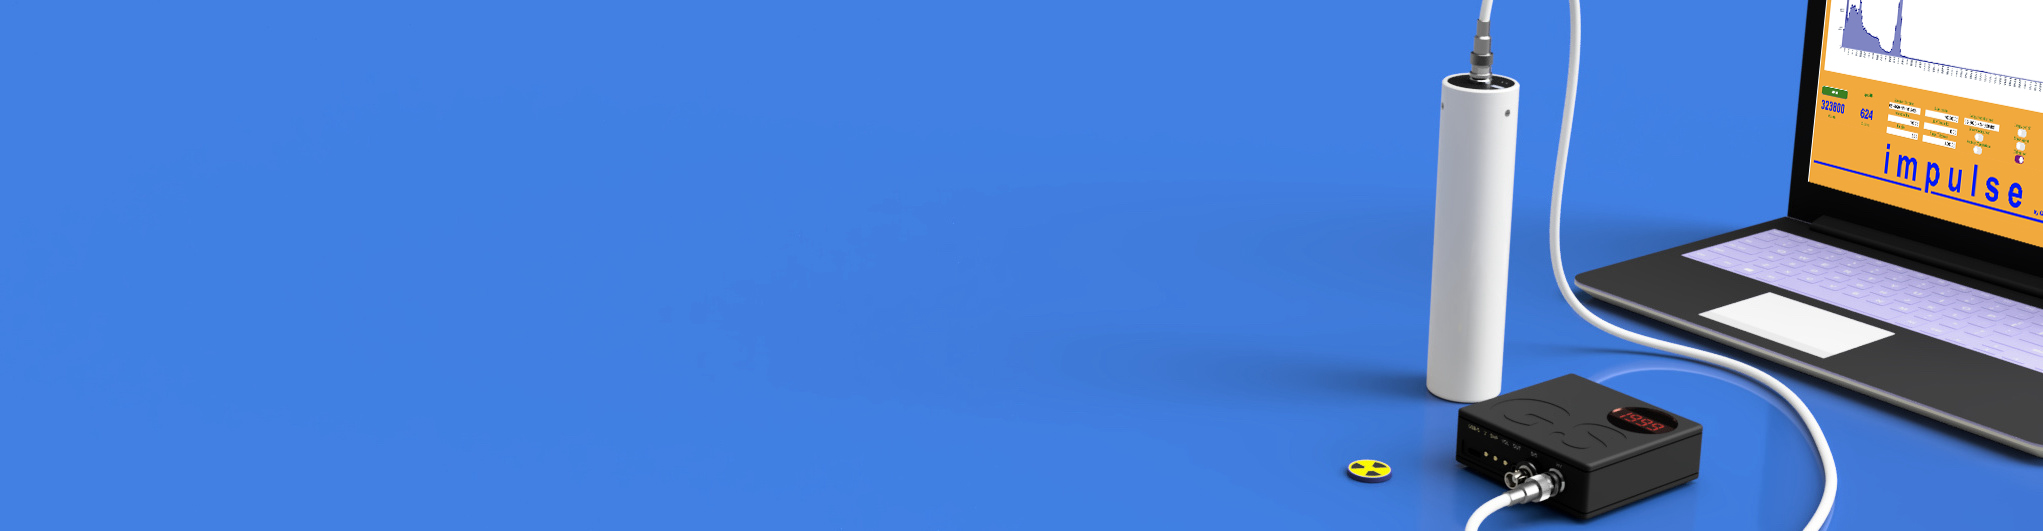
As you can see the probably most interesting feature of this particular unit is the chance to download data on a PC and see the dose rate superimposed on a map, this is possible because the device has a GPS built in it.
Unfortunately the link I’ve been given to download the manual is broken so I am still in the process to learn how the software works and I have no screeshots to show yet.
I was very curious to compare the dose rate of this dosimeter with that of the Mirion PDS 100G.
The PED+ oscillates more, but the average is pretty close for my background. Anyway I know I needed something more “punchy” to have a more significant result.
So first I went in the now famous house made of tuff where I am doing Radon monitoring and tested them in a uniform radiation field approximately twice as strong ad my ordinary background. Again, net of oscillations they were generally pretty close, albeit the fact that they are showing the same exact dose rate in the photo is a coincidence, they were both going up and down around 0.20 µSv/h. Again, the PED+ oscillates more while the PDS is more stable.
But I also wanted to try something hotter.
I decided against testing a hot sample at contact, because a very small difference in distance can make a very big difference in the result when you are so close.
I show this using the PDS and a Pentax Thorium lens which is among my hottest samples.
What follows is the same sample tested with the same detector, only difference is the presence of the case which has no real shielding properties, its only function here is to put some 2 mm extra distance between the sample and the crystal and this is enough to make a difference in the region of more than 50%.
You can never be sure to have the same geometry with different detectors so I decided I needed to test at a certain distance, to minimise the intrinsic difference in geometry between the two devices.
To make it even better I noticed the crystal position in the PDS 100G is about a cm further inside the housing than in the PED so I tried to compensate for that placing the PDS housing about 1 cm closer to the sample.
First I tested an Autunite crystal, with results generally in good agreement. Again, oscillation were there more for the PED+ than for the PDS. Generally the PED+ tended to have a slightly higher dose rate reading.
Then I went for something a bit more serious because only the average of a long enough period of time can give you an idea of where you are.
I asked the assistance of some of my hottest samples, to be sure to have a significant dose rate even at 8-10 cm distance. So please welcome the Radium Clock, the Pentax Lens, the Torbernite, the Autunite Crystal and the Monazite.
During the first round setting up the right distance results were very close just by checking the dose rate. By the way the peak dose of 29 µSv/h was from the Autunite crystal at contact.
Once I did the experiment over a 15 minutes time a 20% difference emerged. The PDS got an average of 1.4 µSv/h, so an accumulated dose of 0.35µSv over 15 minutes.
The PED got 0.43 µSv over the same period of time.
Given the intrinsic margin of error of both devices and the fact that, well, the whole thing was set up in 10 minutes probably not in the most accurate way possible, I would say the result is not that bad.
So this was the Tracerco PED+, more on this as soon as I learn to use the software properly.
Massimo
Tracerco PED + Personal Electronic Dosimeter
Last edited by Go-Figure on 13 Oct 2019, 09:31, edited 2 times in total.
Re: Tarcerco PED + Personal Electronic Dosimeter
By the way, I know the PDS crystal is about 1 cm further inside the housing compared with the PED+ tube because in the PDS's back there's a reference point for the gamma detector, circled in the photo below.
Last edited by Go-Figure on 13 Oct 2019, 06:15, edited 1 time in total.
Re: Tarcerco PED + Personal Electronic Dosimeter
It seems to be a great device : hope to see it dealing with other hot samples :-)
Excellent report as always
Daniel, Italy
Re: Tracerco PED + Personal Electronic Dosimeter
Hi Massimo,
We use for some years the Tracerco ped as our pd, I have it every (work)day with me and I must say it works good only one error that I have found, and that is that it is sensitive for static electricity.
E.g. if I take of my woolen sweater off a cold dry day of and I forget to ground myself the dosimeter goes in to alarm and gives a large peak dose in the screen.
We have send it back to the manufacture but there is nothing they can do about it.
Luuk
Last edited by luuk on 14 Oct 2019, 02:04, edited 1 time in total.
Re: Tarcerco PED + Personal Electronic Dosimeter
It will for sure, At contact it gives higher readings than the PDS, but that's probably not very significant.
By the way, that's the spectrum of the "multisample" from the PDS. Ony 15 minutes, less than a half million counts but still you can see most of the peaks. I should have included some Cs137 and Am241 as well!
Thank you for the info luuk!luuk wrote: We use for some years the Tracerco ped as our pd, I have it every (work)day with me and I must say it works good only one error that I have found, and that is that it is sensitive for static electricity.
E.g. if I take of my woolen sweater on a cold dry day of and I forget to ground myself the dosimeter goes in to alarm and gives a large peak dose in the screen.
We have send it back to the manufacture but there is nothing they can do about it.
I only received it on friday but it looks good so far. The only problem I have is that I didn't figure out how to make the GPS recording the coordinates associated with the dose rate yet. There's probably something I am doing wrong, hopefully the user guide will help me with that. Do you use that feature?
One thing I noticed is that it takes a little time for the dose rate reading to go back down to the normal background level after the dosimeter spent some time close to a hot sample. The initial decrease is quick, but once it gets around 0.25-0.30 µSv/h it stays there a little while before going down to the normal background. Maybe once the doserate is relatively low it averages over a longer perod of time.
Massimo
Re: Tracerco PED + Personal Electronic Dosimeter
Hi folks,
I finally learned how to use the software.
Before getting into details a few advice for those who might be interested in the device which can save you a couple of days of fruitless attempts and a growing sense of frustration:
- The user manual will advice you to set the logging option "Intelligent Logging", but apparently that's no good the first time you try to pick up GPS signal. Nobody tells you that.
- Even with the right setting it took me no less than 13 minutes standing in an open area before the GPS started to work. After that it picked up in a few seconds after losing signal or turning the device off.
- The device has bluetooth, but it's only supposed to work with the Android App "DoseVision Live" (which shows you dose rate, peak dose and accumulated dose on the phone screen). The actual software that you use to download the data in the computer ONLY works connecting the device to the PC with the usb cable.
Having said that, the software alllows you to enable and disable features and change settings in the device, I think the image is self-explanatory. You can then visualise the datalog graphically, you can zoom in and see it day by day, hour by hour and minute by minute. You can see dose rate, dose peak and accumulated dose. And finally the GPS view. Below you can see the datalog of a short car trip I did to go go to work earlier today. The GPS doesn't pick up great inside a car obviously so the device was put near the car window. The graph is a bit crowded because the logging option was 10 seconds, so there's a data point every 10 seconds. Moving the mouse close to every point you see the data, the colour is linked to the dose rate.
Massimo
Who is online
Users browsing this forum: No registered users and 112 guests